I want to tackle sentiment analysis using R in a simple way, just to get me started. With this in mind we begin loading all the packages we’ll be using.
| |
Then we need to load our dataset. This data comes from Kaggle Fake and real news dataset.
| |
I want to merge the two datasets, but first we need to create a new column that will tell me where the data came from.
| |
Now we can start the data cleaning. In this first moment, we’ll do a simple tokenization on the title and text variables. Then we’ll be removing the stopwords according to the snowball source from the stopwords package.
| |
With the tidy data we can select the ten most frequent words from which title news’ group.
| |
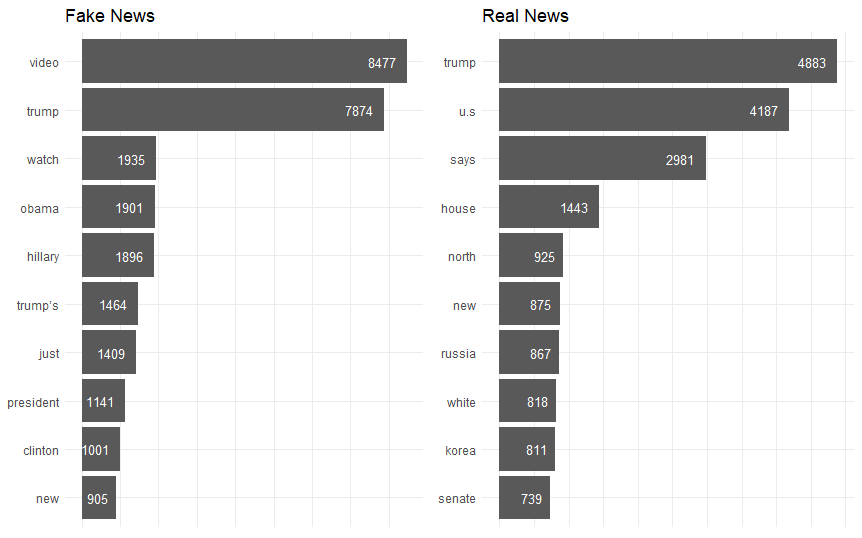
Fake news titles mention video and trump by a large margin, 8477 and 7874 respectively. On the real news titles, trump is also one of the most mentioned, coming on first with 4883 appearances, followed by u.s, 4187, and says with 2981.

Now we prepare the data to the sentiment analysis. I’m interested in classifing the data into sentiments of joy, anger, fear or surprise, for example. So I’ll be using the nrc dataset from Saif Mohammad and Peter Turney.
| |

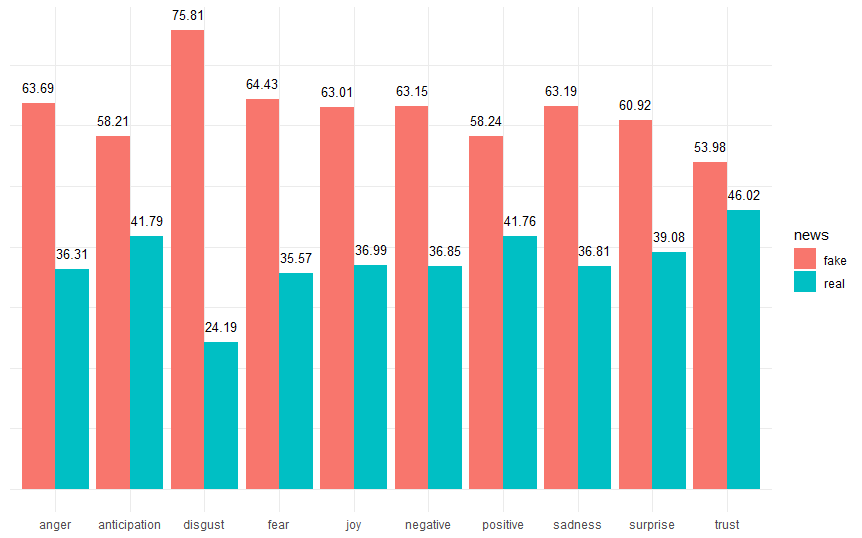
Disgust seems to be the most common sentiment around fake news titles while trust is the lowest, even though it still is more than 50%. Overall fake news titles seems to have more “sentiment” than real news in this particular dataset. Even positive sentiments like joy and surprise.
| |
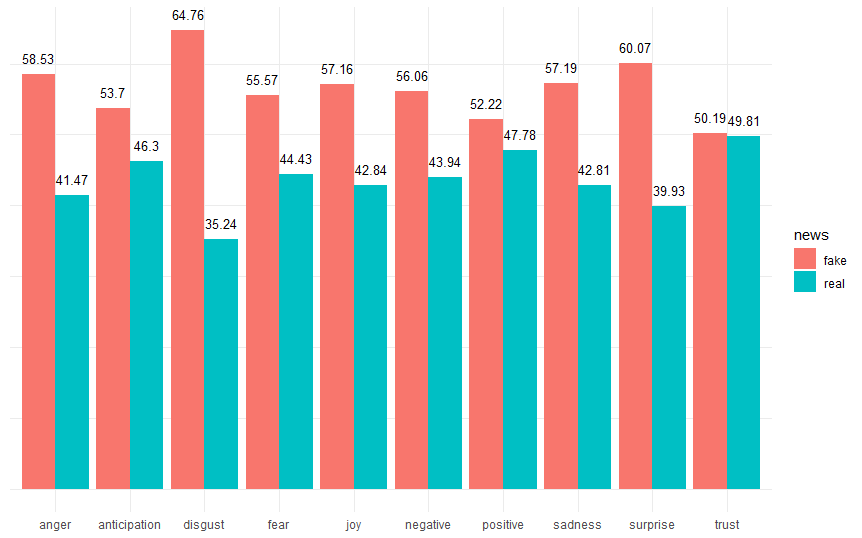
For the news’ corpus we can see the same sentiments are prevalent, but the proportion is lower compared to the title. A fake news article loses trust when the reader takes more time to read it. It also becames less negative and shows less fear.

An improvement we could do here is to use our own stopwords and change the way we made the tokens. We had instances were trump and trump’s didn’t correspond to the same thing and if we had used this data to train a model this could become problematic.
