Learning how to make better visualizations come with study and practice, today I want to talk about sources you can use to guide you into making better graphs and other data visualizations in general.
From Data to Viz

From Data to Viz brings a lot of tools to help navigate the data visualization world. In the website Explore tab you are faced with an interactive infographic that helps you pick a plot, you can choose between: numeric, categoric, numeric&categoric, maps, network, and time series. But it doesn’t only show plots that would be good for your type of data, it also shows a description explaining the plot and common mistakes people make when using that specific plot.
At the end of each branch from the infographic, there is also a story link, where you can read about an implementation of that type of plot using real-world data.
And in the case, you are just starting and don’t know many terms or are unsure if your data contains too many or few points when you rest your mouse over the options nodes you’ll be able to see a description with an example table representing what that means.
By heading to the Caveats tab you’re able to see a collection of caveats, you can filter them by:
Improvement: all caveats that will suggest some sort of improvement on plots.
Misleading: some plots may be misleading by omitting some information, may it be sample size or how proportionally different two categories are. By reading this you’ll be able to spot bad practices that lead to confusion or manipulation.
This website also provides links to Python and R galleries where you can get code snippets to reproduce these plots.
If you prefer to learn by looking at what not to do, you should check out WTF Visualizations. It showcases bad visualizations that don’t make sense or are somehow misleading.
There you’ll find several pie plots that don’t add up to 100%, area graphs where the numbers don’t match the area, and just straight-up manipulation like the example below.
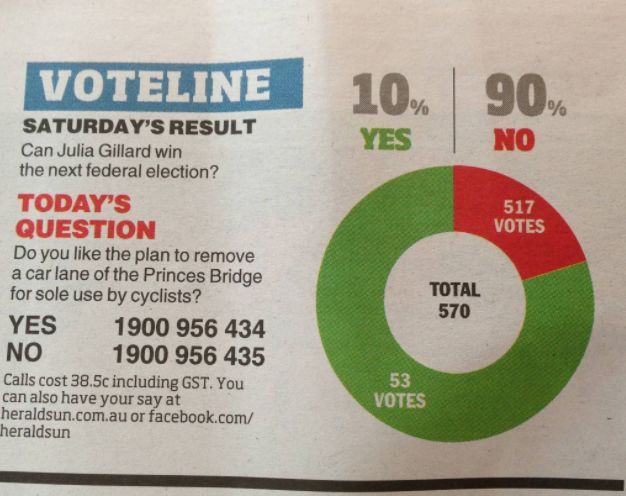
piechart from WTF Visualizations