Recently I finished an Alura course named Python for Data Science and I want to put what I learned into practice, to do so I’ll make a descriptive analysis on this dataset Amazon Top 50 Bestselling Books 2009 - 2019. It contains 550 books and the data has been categorized as fiction and non-fiction by Goodreads. All of the code can be found here.
I started checking the first five observations from the dataset.
| Name | Author | User Rating | Reviews | Price | Year | Genre |
|---|---|---|---|---|---|---|
| 10-Day Green Smoothie Cleanse | JJ Smith | 4.7 | 17350 | 8 | 2016 | Non Fiction |
| 11/22/63: A Novel | Stephen King | 4.6 | 2052 | 22 | 2011 | Fiction |
| 12 Rules for Life: An Antidote to Chaos | Jordan B. Peterson | 4.7 | 18979 | 15 | 2018 | Non Fiction |
| 1984 (Signet Classics) | George Orwell | 4.7 | 21424 | 6 | 2017 | Fiction |
| 5,000 Awesome Facts (About Everything!) (Natio… | National Geographic Kids | 4.8 | 7665 | 12 | 2019 | Non Fiction |
Here it’s possible to see that the data has the Year in which the book was on the top 50 list, it’s Price, the average User Rating, total Reviews, Author, Name and lastly, Genre.
There are no null values in the dataset. And from 550 books there are 248 unique authors, so let’s see which authors have had more books in the top 50 bestselling during this period.
| Author | Number of Books |
|---|---|
| Jeff Kinney | 12 |
| Gary Chapman | 11 |
| Rick Riordan | 11 |
| Suzanne Collins | 11 |
| American Psychological Association | 10 |
| Dr. Seuss | 9 |
| Gallup | 9 |
| Rob Elliott | 8 |
| Stephen R. Covey | 7 |
| Stephenie Meyer | 7 |
| Dav Pilkey | 7 |
| Bill O’Reilly | 7 |
| Eric Carle | 7 |
The author with more books in the top 50 list was Jeff Kinney, tied at second, with 11 books, was Gary Chapman, Rick Riordan, and Suzanne Collins. Tied at 9th is Stephen R. Covey, Stephenie Meyer, Dav Pilkey, Bill O’Reilly, and Eric Carle, with 7 books.

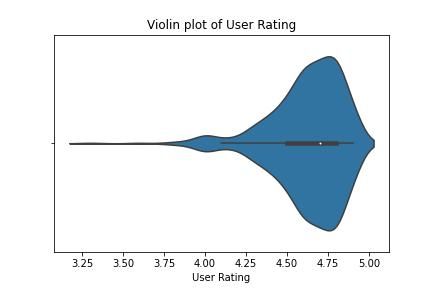
With the violing plot, we can see how the user rating is concentrated and because our data is composed of bestsellers it makes sense that the user rating is mostly concentrated around 4.5 and 4.75.

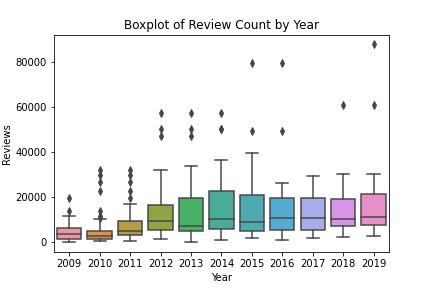
This boxplot of reviews count by year shows that the variability increases through the years, having its peak at 2014 and gradually stabilizing. We can also see that in the first years, 2010 and 2011, there were more outliers in the data.
I wanted to look at the user rating and price by book genre. So I calculated these average values.
| Genre | User Rating | Price |
|---|---|---|
| Fiction | 4.65 | 10.85 |
| Non Fiction | 4.60 | 14.84 |
The user rating average by genre seems to be similar just 0.05 difference, but the price has a bigger difference 10.85 for fiction and 14.84 for non-fiction books. To be sure that these differences are statistically significant I’ll use the Mann-Whitney test.
The Mann-Whitney null hypothesis is that the samples have the same distribution, and in both cases, we reject the null hypothesis with a 95% confidence level. The p-value for the price data was 8.34e-08 and the user rating was 1.495e-07.
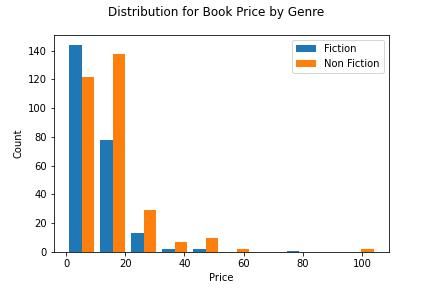
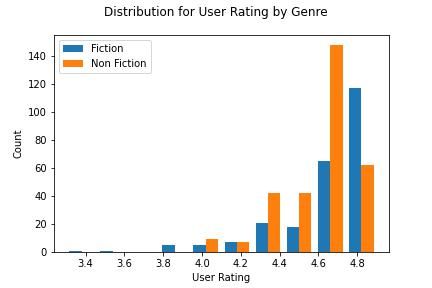
To visually show how different their distribution is we can take a look at the following plots.

The distribution for the price of fiction books is heavily inclined to the left and consistently diminishes as the price goes up. While the non-fiction books price starts high and becomes even higher, 120 and almost 140 occurrences in the first two categories, then it rapidly diminishes.

The distribution for the user rating by the fiction genre slowly increases, having its peek at around 4.8. And the distribution of the non-fiction genre has its peak at a little over 4.6.
